Explainer
Correlation or causation?
Did you know that countries that tip more also have more political corruption? Or that your finger length determines whether you are good at maths? Seem suspicious? Well, your cautiousness might be warranted. These weird correlations do not actually reflect things that cause one another. Confused? Well, here we are going to explain what correlation is and how it is distinct from causation. While we're at it, we will discuss when it makes sense to use correlation, and what type of correlation is best for your data.
What is correlation?
We, as human beings, try to make sense of the world around us. We like to see patterns in our everyday lives and draw conclusions about them. However, we often look for patterns which match our pre-existing views, and, inevitably, we find support for those views, and so on. This trait is known as confirmation bias and it underlies our confusion about correlation and causality. Correlation measures the strength of a relationship between two variables. For example, take the variable "temperature", which we will call T, and the "ice cream sales", called S. We can use correlation to see whether a change in S tends to happen when there are changes in T. In other words, when temperature increases, do ice cream sales change? But beware, correlation can not be used to tell you anything about directionality between variables. So if we find a correlation, it might be because changes in T cause changes in S, or changes in S cause changes in T, or both changes are due to another factor altogether, or even by chance (!).
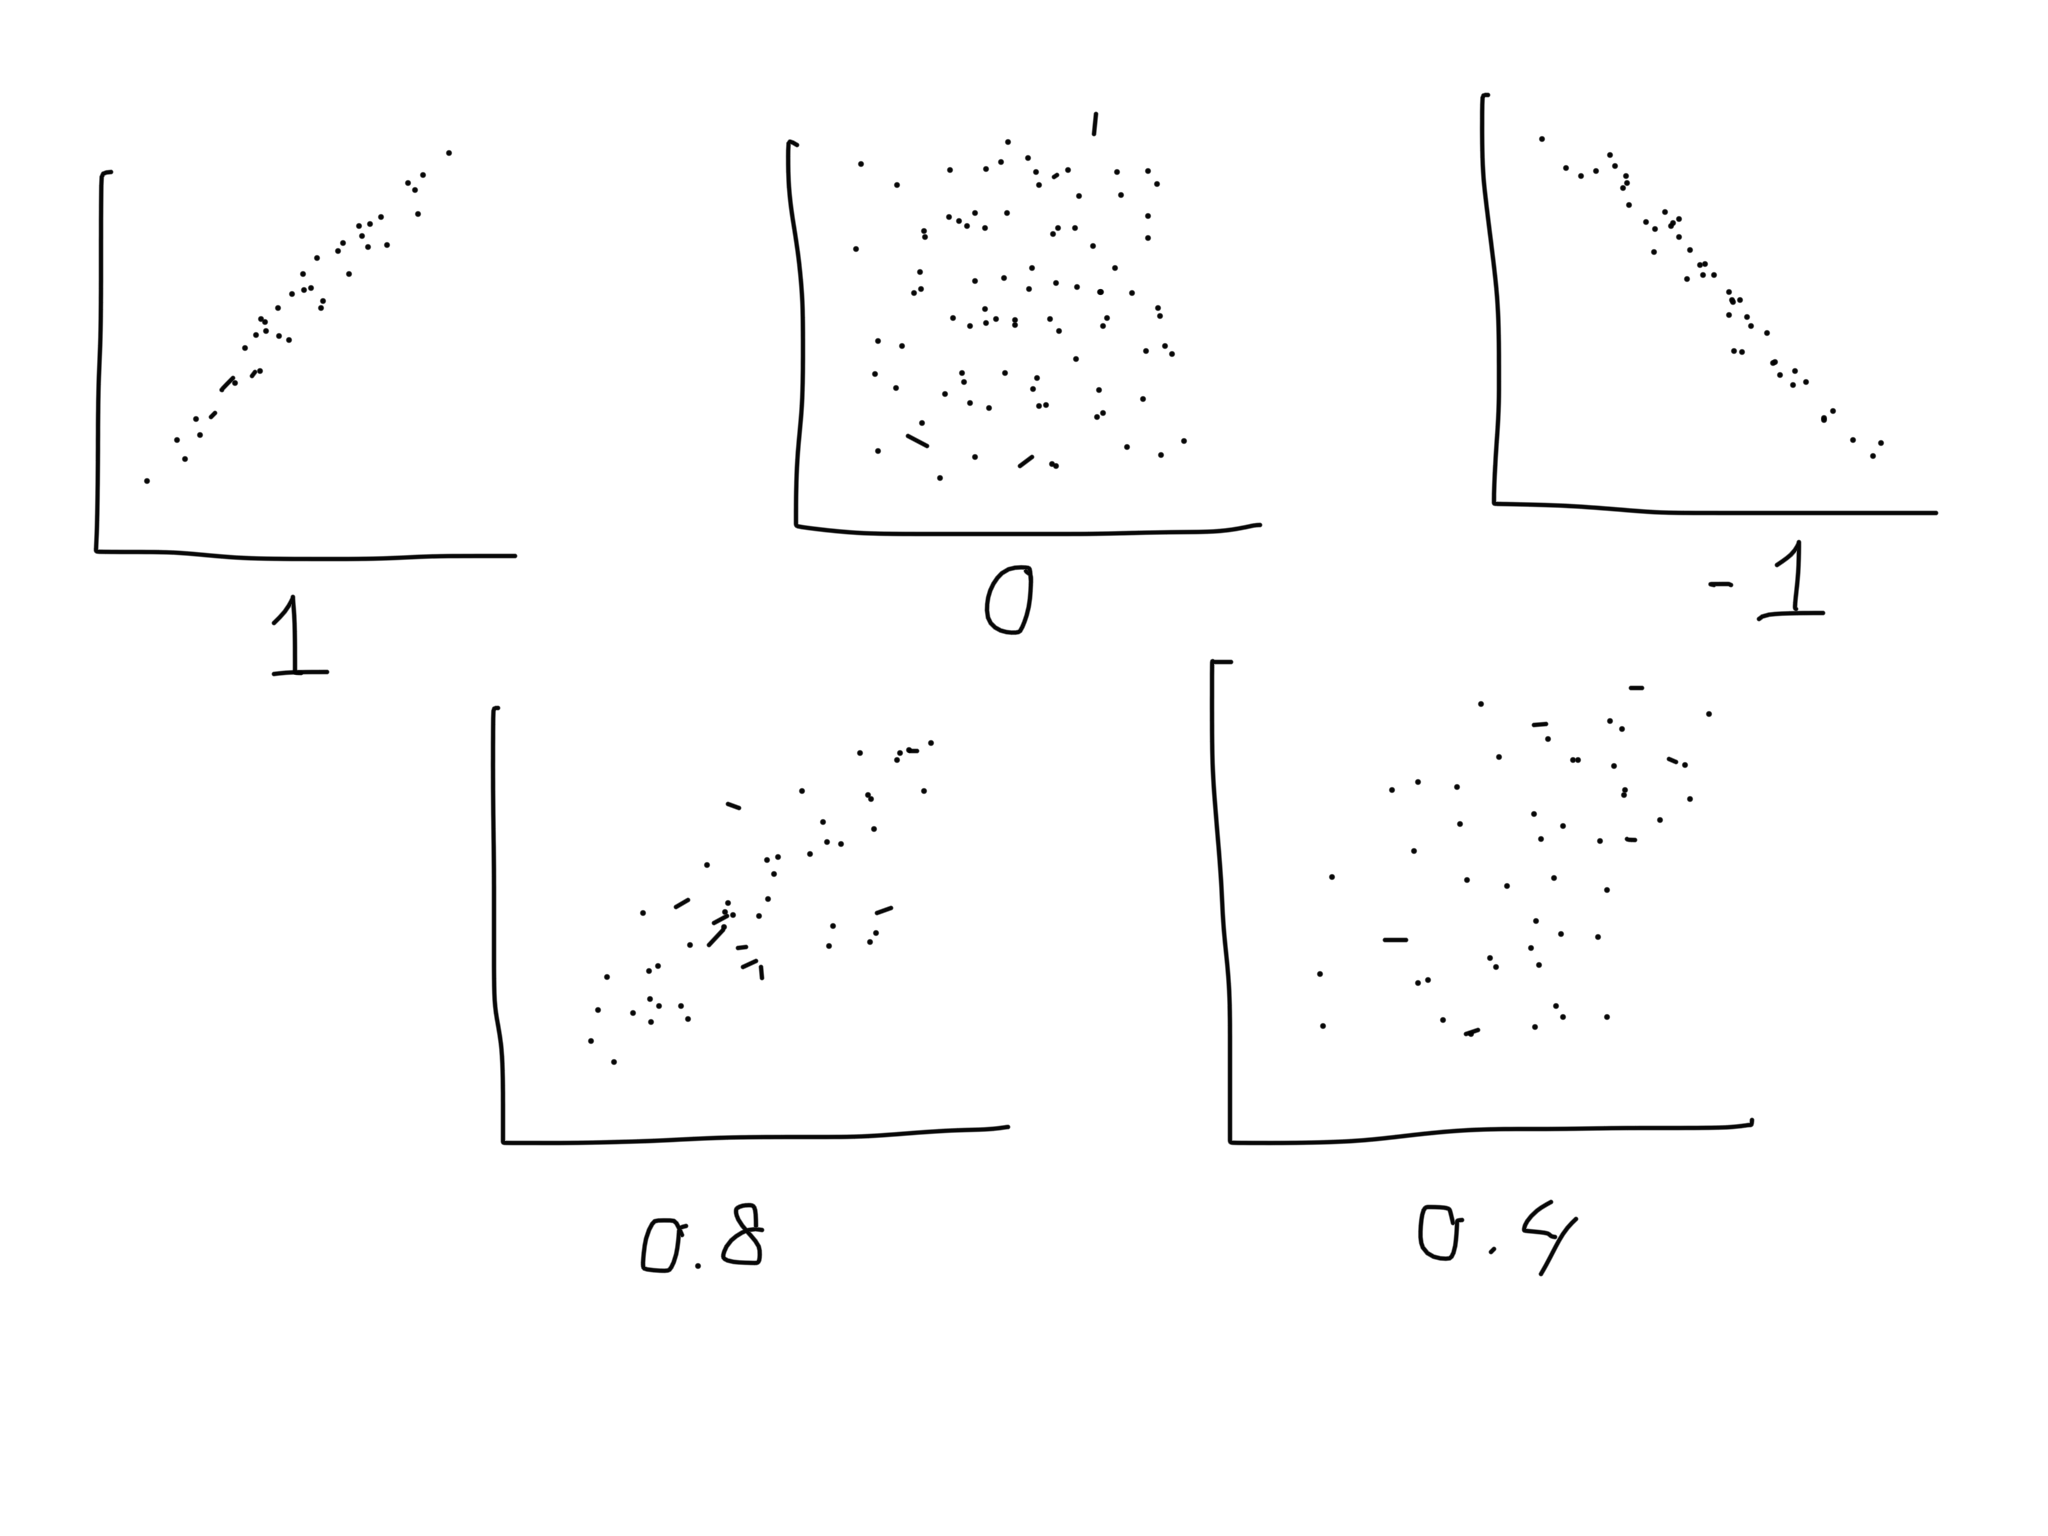
To determine whether T and S are correlated, we visualise the data using scatterplots and look for relationships, or trends. Most researchers look for linear trends in their data, popularly using a Pearson correlation. However, nonlinear trends can also be determined using techniques such as Kendall rank correlation or Spearman correlation (see below). The strength of the relationship between the variables is quantified by a certain measure called the correlation coefficient.
Caution!
So correlation is not causation, but is correlation the same thing as regression? Well, yes and no. In the simplest case, you can use both to quantify the strength of the relationship between two variables, and this strength is the same. However, with regression, you are actually creating a model to explain the relationship between the variables, and you often make the assumption that one variable explains another (most appropriate when you have experimentally manipulated one of the variables). In regression analysis, you may want to predict the value of S based on the value of T. In that case, S is called the response or dependent variable, and T the explanatory or independent variable.
Correlation coefficient
The correlation coefficient varies between +1 and -1, with values close to 0 indicating that the variables are weakly related and values close to +1 and -1 indicating that the variables are more strongly related. The + and - sign indicate whether the correlation is either positive or negative. A positive correlation shows an increasing line in the scatterplot and means that an increase in one variable co-occurs with an increase in the other as well. In our example, this would mean that increasing values of T would also show an increases in S. A negative correlation shows a decreasing line in the scatterplot; in our example, this would mean that when T is smaller, so is S. The closer the value to +1 or -1, the closer we are to having a perfect correlation, which looks like all the data points forming a straight line (instead of a cloud). For correlation coefficients close to 0, we say that there is no correlation. In this case, when T changes, nothing happens to S (and vice versa).
We have been talking here about the Pearson r correlation coefficient, which is very common. Depending on the type and distribution of your data, you may also want to use several other types of correlation coefficients, such as r, τ (Kendall's) or ρ (Spearman's).
What type of correlations exist?
The three most often-used types of correlation are Pearson correlation, Kendall rank correlation, and Spearman correlation.
- Pearson r correlation is used to measure the correlation between two linearly-related variables. Our example with temperature, T, and sales of ice cream, S, is an example of linearly related variables. This just means that the values increase or decrease together at a constant rate. This will give a straight line relationship between the variables. You have to keep in mind a couple other assumptions you need to check when using a Pearson's correlation: (1) that both variables are normally distributed, which relates to the other assumption of (2) homoscedasticity. Homoscedasticity occurs when data is normally distributed about the regression line.
- What if your data is not normally distributed? Well, you have several options. If you are not easily able to normalise the data, you might choose to use either a Kendal rank correlation or to Spearman rank correlation. Kendall rank correlation is for non-parametric (i.e. not-normally distributed) data that is ordinally distributed. Ordinal data has a certain order (you wouldn't say eh?). For example, when you fill out a questionnaire about how much you like chocolate: not at all, reasonably, good, best thing ever. Kendall's τ indicates the ordinal association between the data of the two variables. A τ correlation coefficient of 1 indicates that the variables have a similar rank, and a τ of -1 means a dissimilar rank between the variables. Kendall correlation is only usable for discrete variables, because it only looks at whether the ranks between the variables are equal or not.
- In Spearman rank correlation, you can use continuous data for your non-parametric data set. Another feature of the Spearman's ρ correlation is that it does not make any assumptions about the distribution of the data. You will use the Spearman rank correlation when the variables are measured on a scale that is at least ordinal, so it can also be categorical.
In addition to these most common correlation types for non-normally distributed data there are several other approaches for dealing with non-normally-distributed variables (e.g. transformation). Also, imagine you want to perform a correlation between more than two variables ... no problem. A correlation matrix computes dependencies of multiple variables by performing a correlation with each pair of variables. The result is a table with r values corresponding with each pair. A correlation matrix is quite similar to the covariance matrix.
Correlating Big Data
Hooray, you made it this far! Awesome. You now have some theoretical knowledge and an idea about what test you should use for your data. So maybe you also have a lot of data, also known as Big Data. Nowadays, Big Data is very popular, almost as popular as Benedict Cumberbatch, but then in the data science world. People mainly use Big Data to look for patterns, and you know now what this is called: correlations. However, bigger is not always better, because with a lot of data it is mighty easy to find a correlation where there is none. This can lead to useless outcomes ... and that is kind of a bummer. Therefore, you can not use correlation whenever you like, as every test makes lots of assumptions and have their limitations. These important rules are too often ignored when analysing Big Data, and there are other problems as well: hidden variables, sampling problems, misinterpretation of the data, etc. This all can lead to unjust conclusions about the data, such as this example involving Miss America and murder rates: funny graphs between completely unrelated correlations.
Take home thought
We can't repeat this enough: know your data inside out! This is how you choose the right model to analyse your data, such as choosing between a Pearson's or Spearman's correlation. In correlation, you look at whether two variables of your data co-occur, however, this does not indicate any causation. If you want to check multiple variables for correlation, you can use a correlation matrix and create multiple scatter plots. But be cautious, because knowing your data is super important when you deal with Big Data, as there are many pitfalls and booby traps.